donut_polygons() turns tidy category values at spatial locations into an
sf polygon layer. Each row of data represents one category for one
location.
Usage
donut_polygons(
  data,
  id,
  category,
  value,
  lon = NULL,
  lat = NULL,
  input_crs = 4326,
  crs = NULL,
  map = NULL,
  radius_range = NULL,
  inner_radius = 0.55,
  n = 96,
  start_angle = pi/2
)
Arguments
- data
A data frame or
sfobject. Ifdatais not ansfobject,lonandlatmust be supplied.- id
Unquoted column identifying each donut location.
- category
Unquoted column identifying donut categories.
- value
Unquoted numeric column giving non-negative category values.
- lon, lat
Unquoted longitude and latitude columns. Required when
datais not ansfobject.- input_crs
Coordinate reference system for
lonandlat, or for ansfobject with missing CRS. Defaults to EPSG:4326.- crs
Target projected CRS used to build the donut polygons. If
NULL, a projected CRS is chosen frommap,data, or an estimated UTM zone.- map
Optional
sfobject used only to choose the working CRS and default donut radius range.- radius_range
Numeric vector of length 2 giving minimum and maximum donut radii in map units. If
NULL, a range is derived from the map extent.- inner_radius
Numeric value in
(0, 1)giving the inner radius as a proportion of the outer radius.- n
Number of points used to approximate a complete outer circle.
- start_angle
Start angle in radians. The default starts at 12 o'clock.
Examples
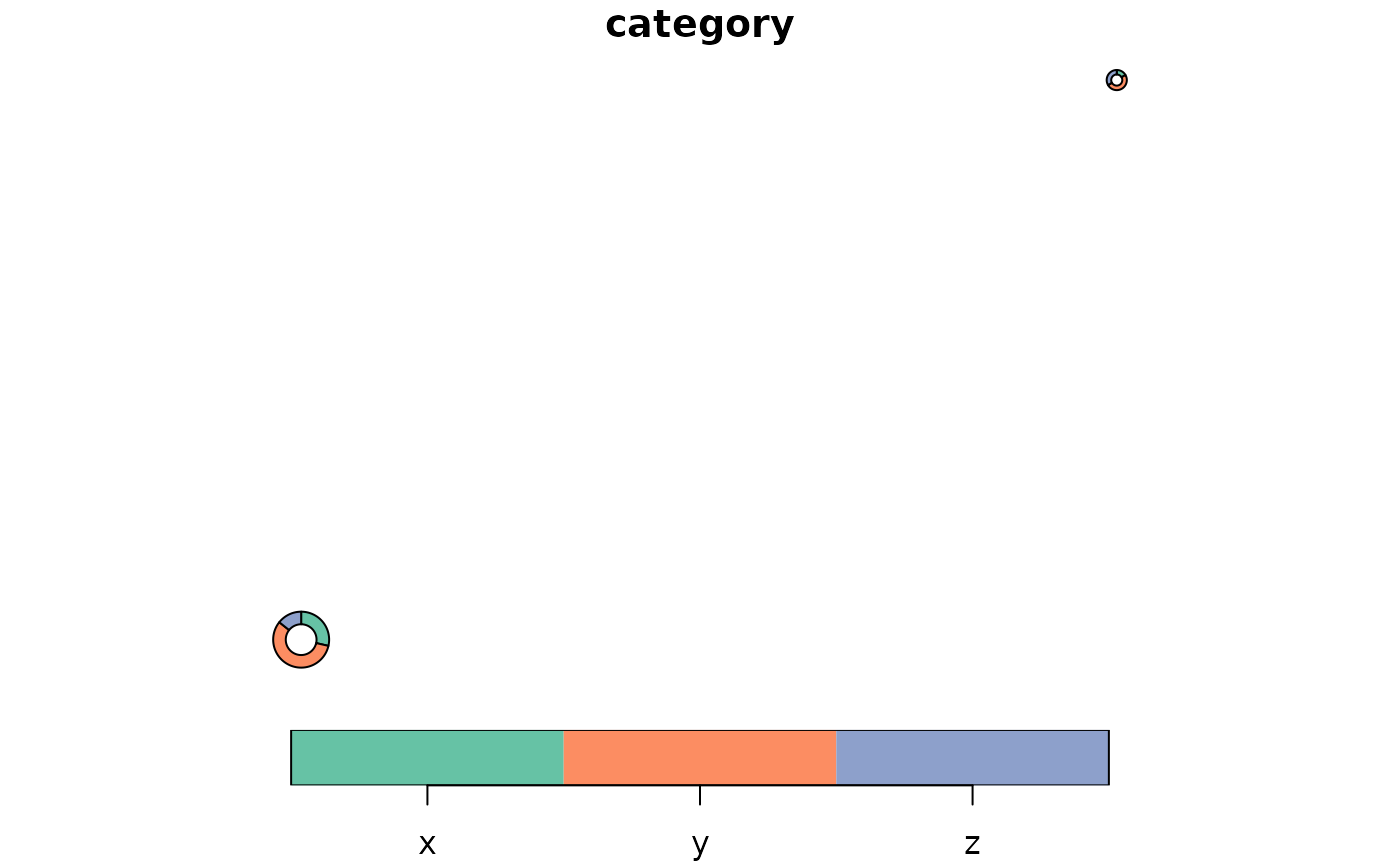
demo <- data.frame(
  place = rep(c("A", "B"), each = 3),
  lon = rep(c(-71.3, -71.1), each = 3),
  lat = rep(c(46.75, 46.85), each = 3),
  category = rep(c("x", "y", "z"), times = 2),
  value = c(10, 20, 5, 5, 15, 10)
)

donuts <- donut_polygons(demo, place, category, value, lon = lon, lat = lat)
plot(donuts["category"])