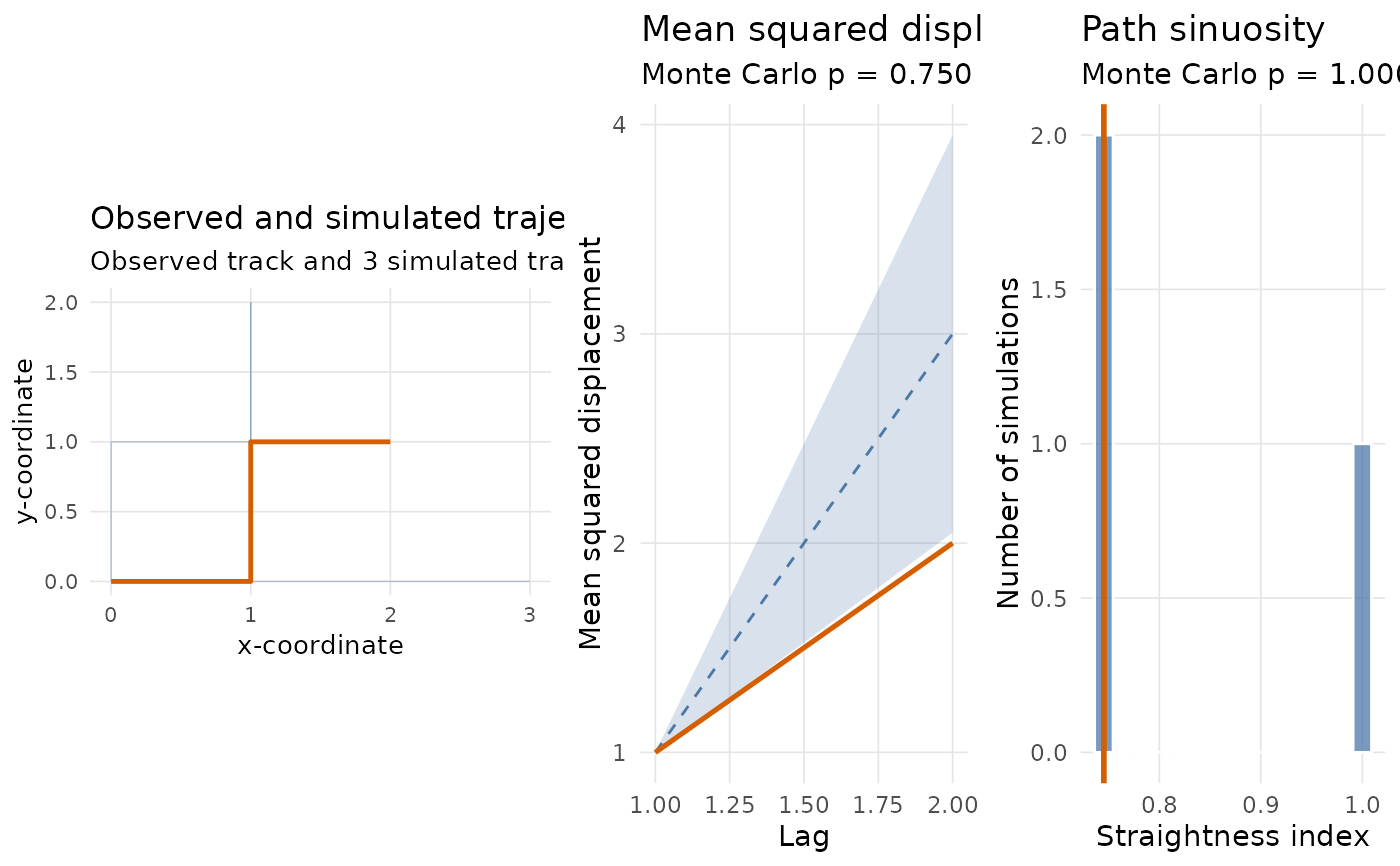
Draws a compact multi-panel dashboard for a gmov_generative result. When
observed and simulated tracks are supplied, the first panel shows observed
and simulated trajectories. The remaining panels show the available
diagnostic plots using the same plotting methods as plot.gmov_generative().
This is a visualization helper only; it does not compute additional
validation metrics.
Arguments
- x
An object returned by
validate_ssf_generative().- observed
Optional observed track-like object. If supplied with
simulated, a trajectory panel is included.- simulated
Optional simulated tracks, in any format supported by
as_gmov_simulations(). If supplied withobserved, a trajectory panel is included.- n_simulations
Maximum number of simulated tracks shown in the trajectory panel.
- ...
Passed to
as_gmov_track()andas_gmov_simulations()when building the trajectory panel.
Examples
observed <- data.frame(x = c(0, 1, 1, 2), y = c(0, 0, 1, 1))
simulated <- list(
  data.frame(x = c(0, 1, 2, 3), y = c(0, 0, 0, 0)),
  data.frame(x = c(0, 0, 1, 1), y = c(0, 1, 1, 2)),
  data.frame(x = c(0, 1, 1, 1), y = c(0, 0, 1, 2))
)
res <- validate_ssf_generative(
  observed,
  simulated,
  metrics = c("msd", "sinuosity"),
  msd_args = list(max_lag = 2)
)
plot_gmov_dashboard(res, observed, simulated)