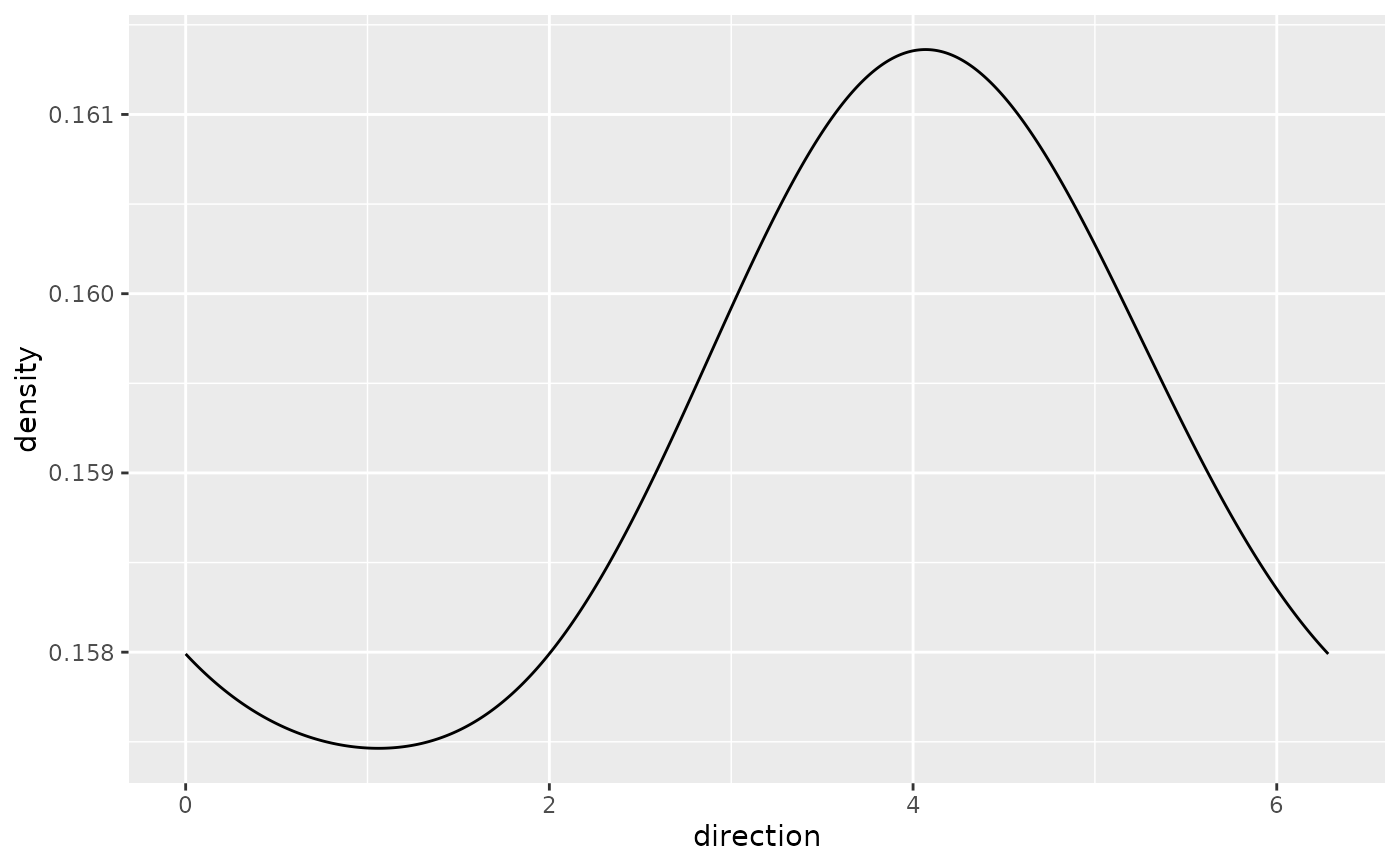
Draws a circular density estimate as a line. This is a convenience wrapper
around stat_circular_density().
Usage
geom_circular_density(
  mapping = NULL,
  data = NULL,
  stat = "circular_density",
  position = "identity",
  ...,
  method = c("kernel", "vonmises"),
  bw = NULL,
  adjust = 1,
  n = 512,
  axial = FALSE,
  na.rm = FALSE,
  show.legend = NA,
  inherit.aes = TRUE
)
Arguments
- mapping, data, position, show.legend, inherit.aes
Standard ggplot2 layer arguments.
- stat
Statistical transformation, usually
"circular_density".- ...
Additional arguments passed to the layer.
- method
Density method. Currently
"kernel"and"vonmises"both use a von Mises kernel estimator.- bw
Optional circular bandwidth. It is interpreted as
1 / sqrt(kappa).- adjust
Multiplicative adjustment applied to
bwor to the automatic bandwidth scale.- n
Number of grid points.
- axial
Should the data be treated as axial, modulo
pi?- na.rm
Should missing values be silently removed?
See also
Other circular density layers:
stat_circular_density()