geom_rose() is a convenience wrapper around stat_rose() using a bar
geometry. It is designed to be used with coord_circular() or
ggplot2::coord_polar().
Usage
geom_rose(
  mapping = NULL,
  data = NULL,
  stat = "rose",
  position = "identity",
  ...,
  bins = 30,
  binwidth = NULL,
  boundary = 0,
  closed = TRUE,
  area = FALSE,
  normalize = c("count", "density", "proportion"),
  axial = FALSE,
  na.rm = FALSE,
  show.legend = NA,
  inherit.aes = TRUE
)
Arguments
- mapping, data, position, show.legend, inherit.aes
Standard ggplot2 layer arguments.
- stat
Statistical transformation, usually
"rose".- ...
Additional arguments passed to the layer.
- bins
Number of bins over the circular period.
- binwidth
Optional bin width in radians. If supplied,
binsis ignored after the number of bins is inferred from the period.- boundary
Lower boundary for the first bin.
- closed
Included for API compatibility. Values on the upper period boundary are wrapped into the first bin.
- area
If
TRUE, radial heights are square-root transformed so that visual area is closer to the selected frequency scale.- normalize
Which scale should be used for the computed radial
yvalue: counts, densities or proportions.- axial
Should angles be treated as axial, modulo
pi?- na.rm
Should missing values be silently removed?
See also
Other rose diagram layers:
stat_rose()
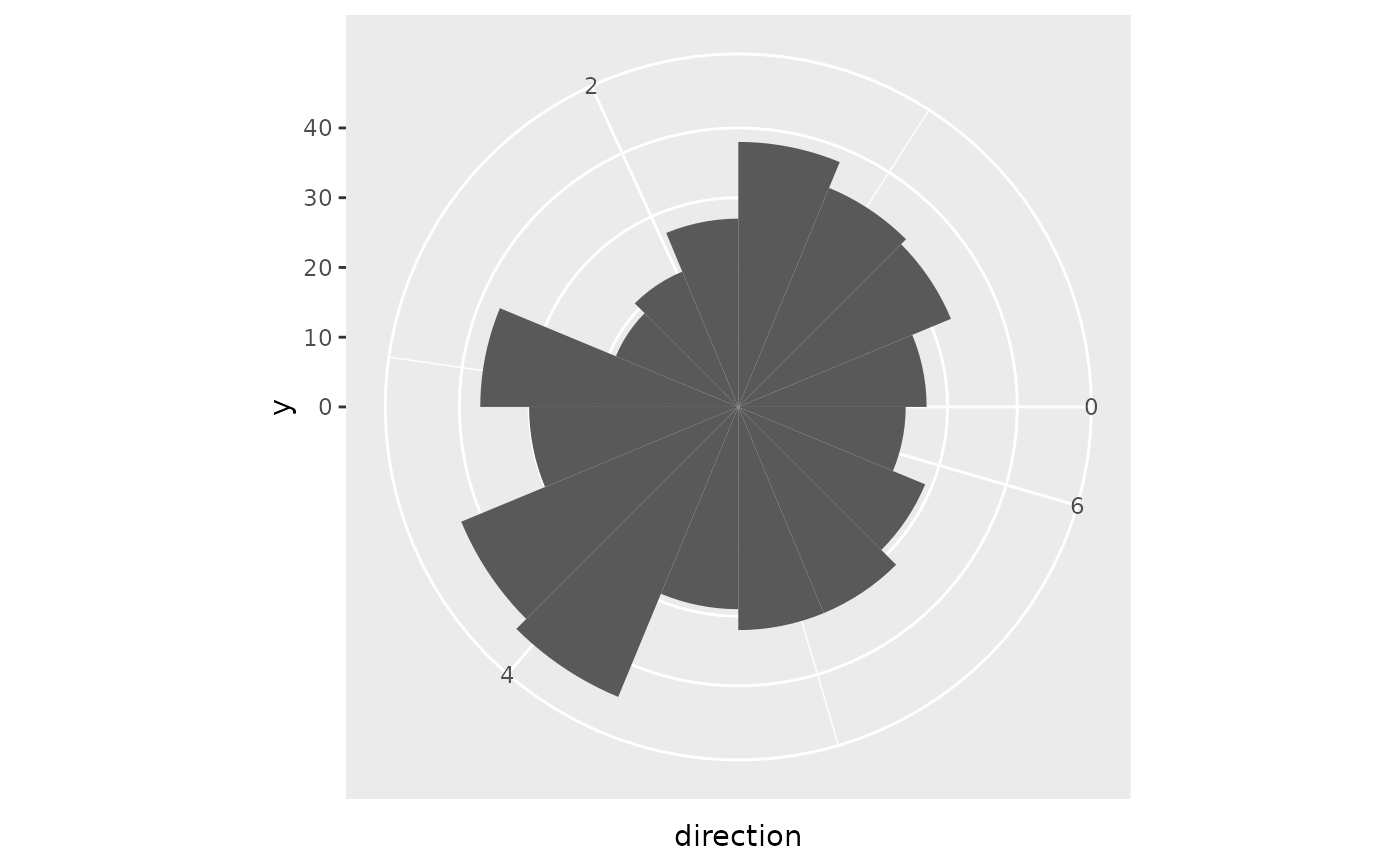
Examples
ggplot2::ggplot(wind_directions, ggplot2::aes(x = direction)) +
  geom_rose(bins = 16) +
  coord_circular()