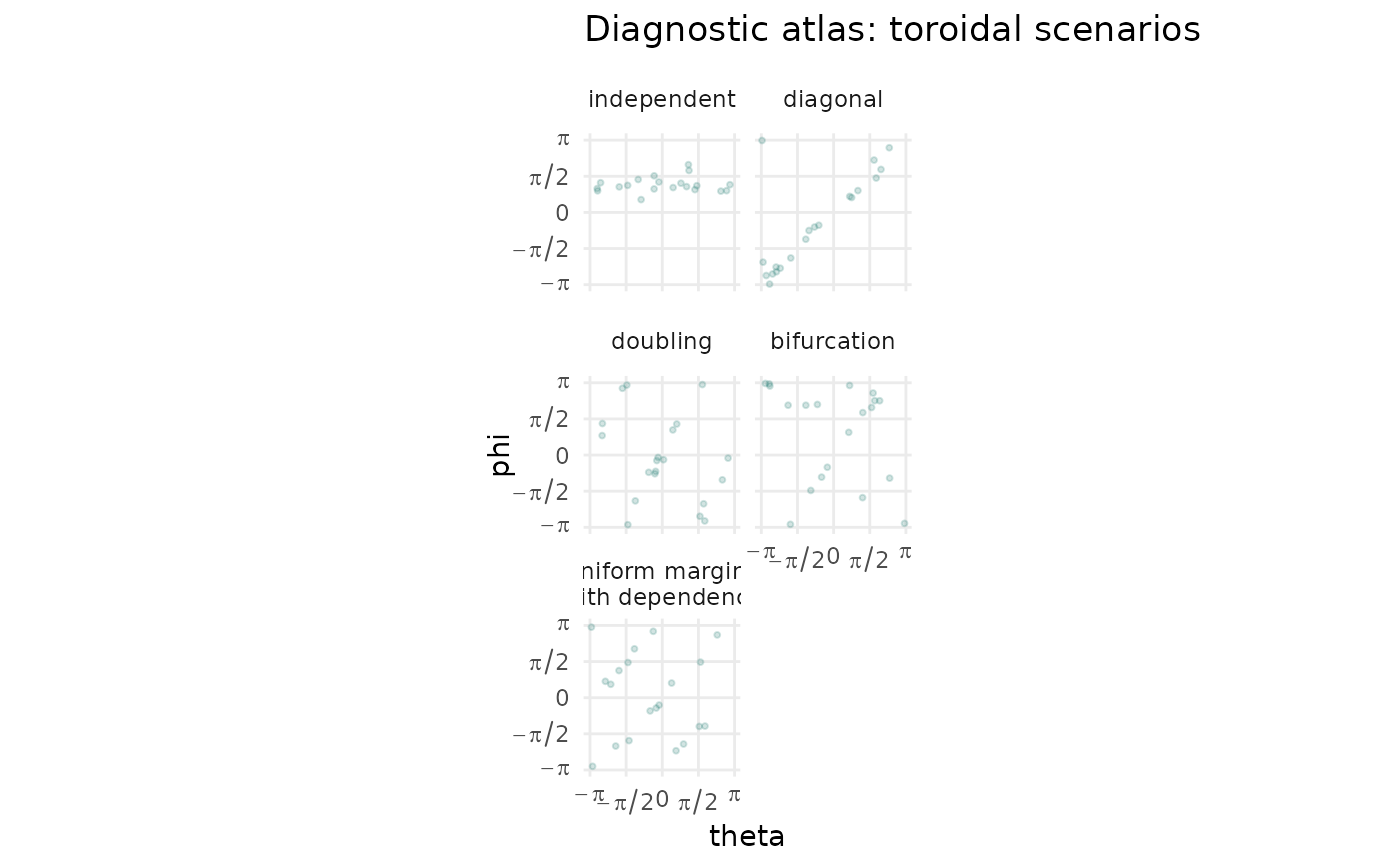
Plot a diagnostic atlas
Usage
plot_diagnostic_atlas(
  space = c("cylindrical", "toroidal"),
  n = 600,
  seed = 20260609
)See also
Other directional diagnostics:
autoplot.diagnostic_atlas_data(),
diagnostic_atlas_data(),
diagnostic_scenarios(),
plot_classical_comparison(),
simulate_cyl_diagnostic(),
simulate_tor_diagnostic()