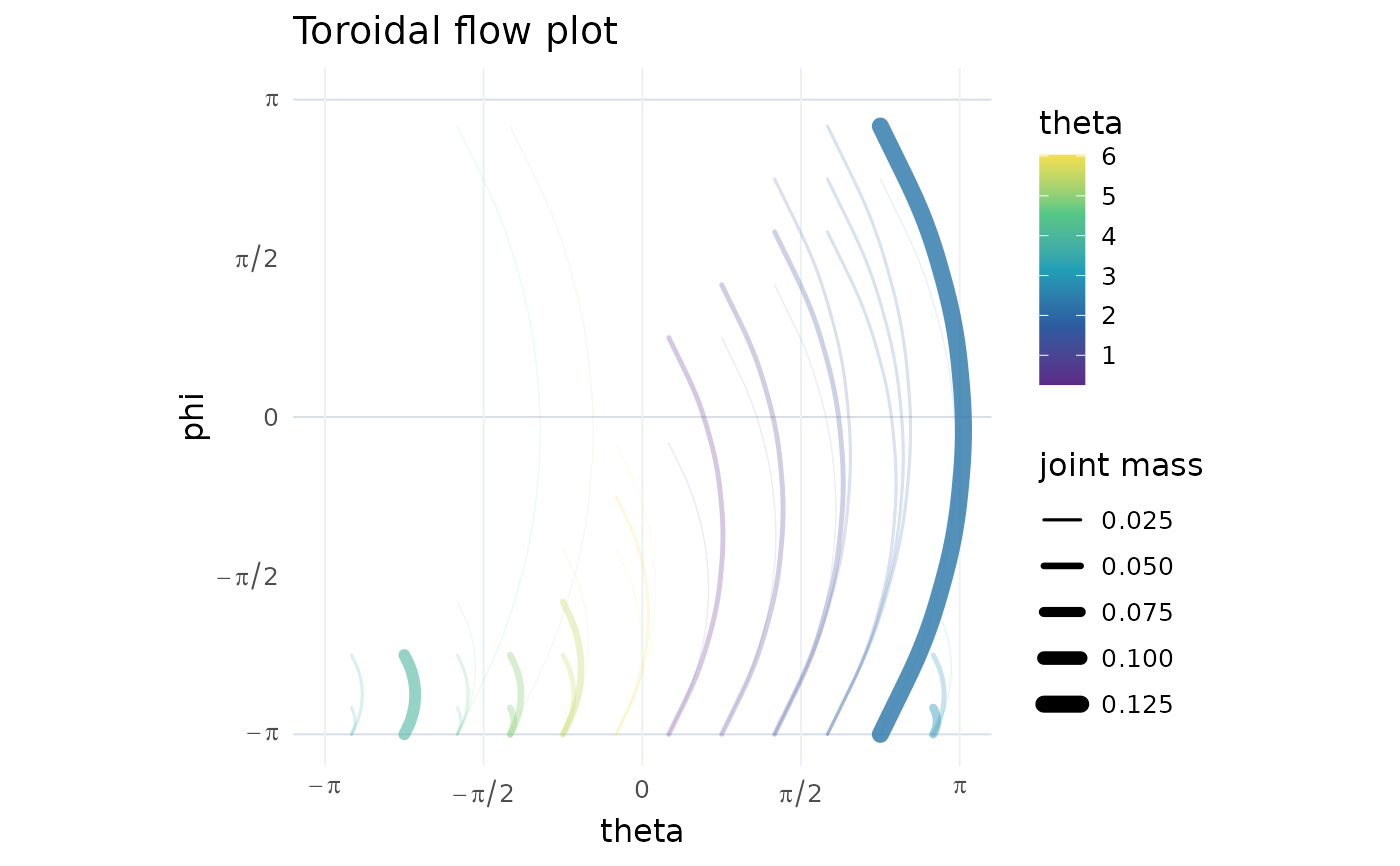
Plot toroidal flow
Usage
plot_toroidal_flow(
  theta,
  phi,
  n_sectors = 32,
  min_mass = 0.002,
  mass_type = c("joint", "conditional"),
  palette = flow_palette(),
  base_size = 12,
  legend_position = "right",
  show_legend = TRUE
)
Arguments
- theta
First angle in radians.
- phi
Second angle in radians.
- n_sectors
Number of sectors for both angles.
- min_mass
Minimum mass to retain.
- mass_type
Either
"joint"for joint masses or"conditional"for masses normalized within eachthetasector.- palette
Colour palette for theta sectors.
- base_size
Base font size.
- legend_position
Legend position.
- show_legend
If
FALSE, hide legends.
See also
Other toroidal dependence plots:
plot_toroidal_ridge(),
plot_toroidal_topography(),
plot_toroidal_topography_3d()
Examples
dat <- simulate_toroidal(n = 80, seed = 1)
plot_toroidal_flow(dat$theta, dat$phi, n_sectors = 12)