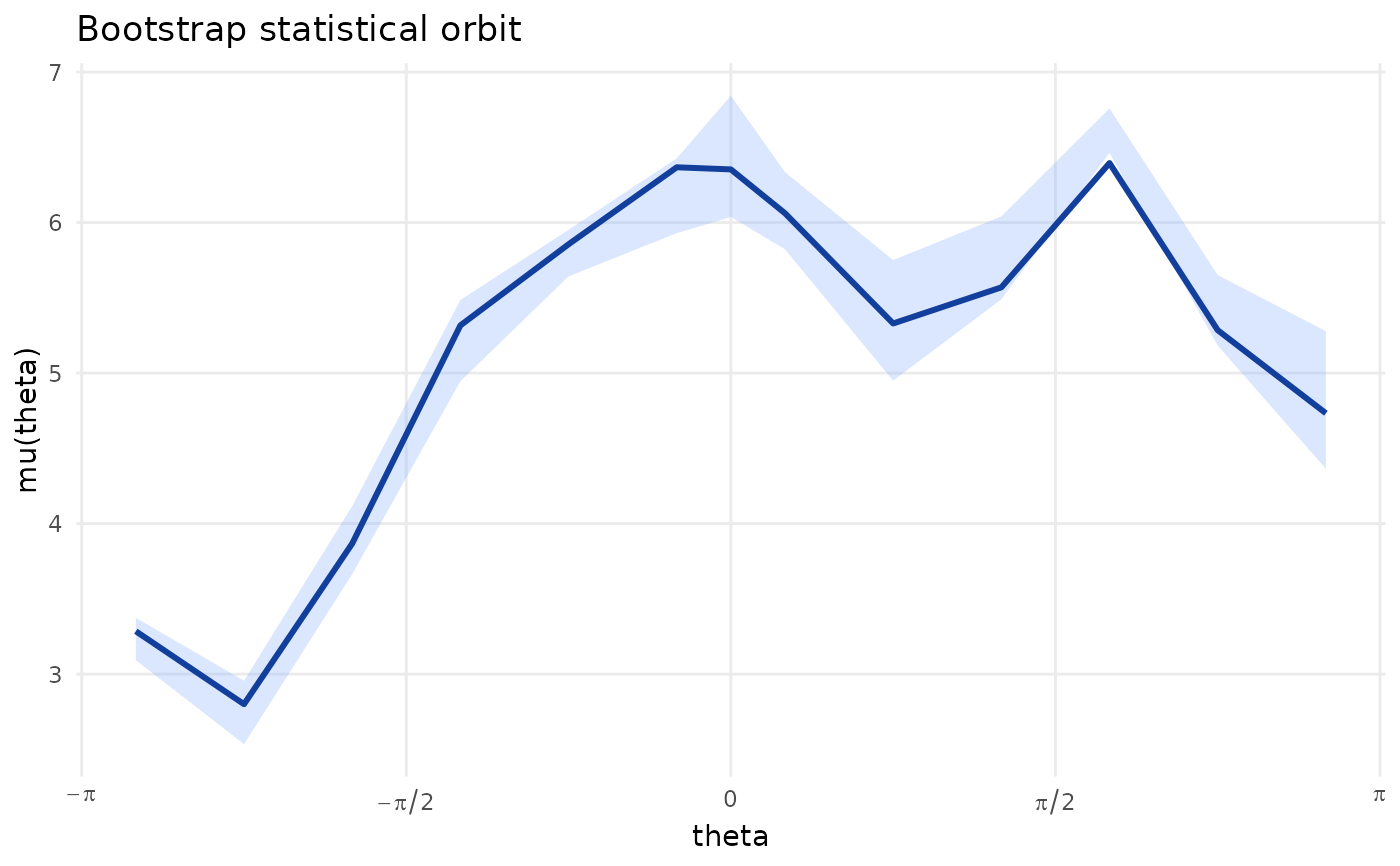
Plot bootstrap uncertainty for a statistical orbit
Source:R/directional-uncertainty.R
autoplot.bootstrap_stat_orbit.RdPlot bootstrap uncertainty for a statistical orbit
Arguments
- object
Object returned by
bootstrap_stat_orbit().- ...
Reserved for future extensions.
- quantity
Either
"mu"or"sigma".- base_size
Base font size.
- ribbon_fill
Ribbon fill colour.
- line_colour
Line colour.
See also
Other directional uncertainty helpers:
autoplot.bootstrap_toroidal_ridge(),
bootstrap_stat_orbit(),
bootstrap_toroidal_ridge(),
marginal_support_data(),
plot_marginal_support(),
sensitivity_bandwidth_grid(),
simulate_independence_lineup()
Examples
dat <- simulate_cylindrical(n = 60, seed = 1)
boot <- bootstrap_stat_orbit(dat$theta, dat$x, n_boot = 5, n_theta = 12, seed = 1)
ggplot2::autoplot(boot)