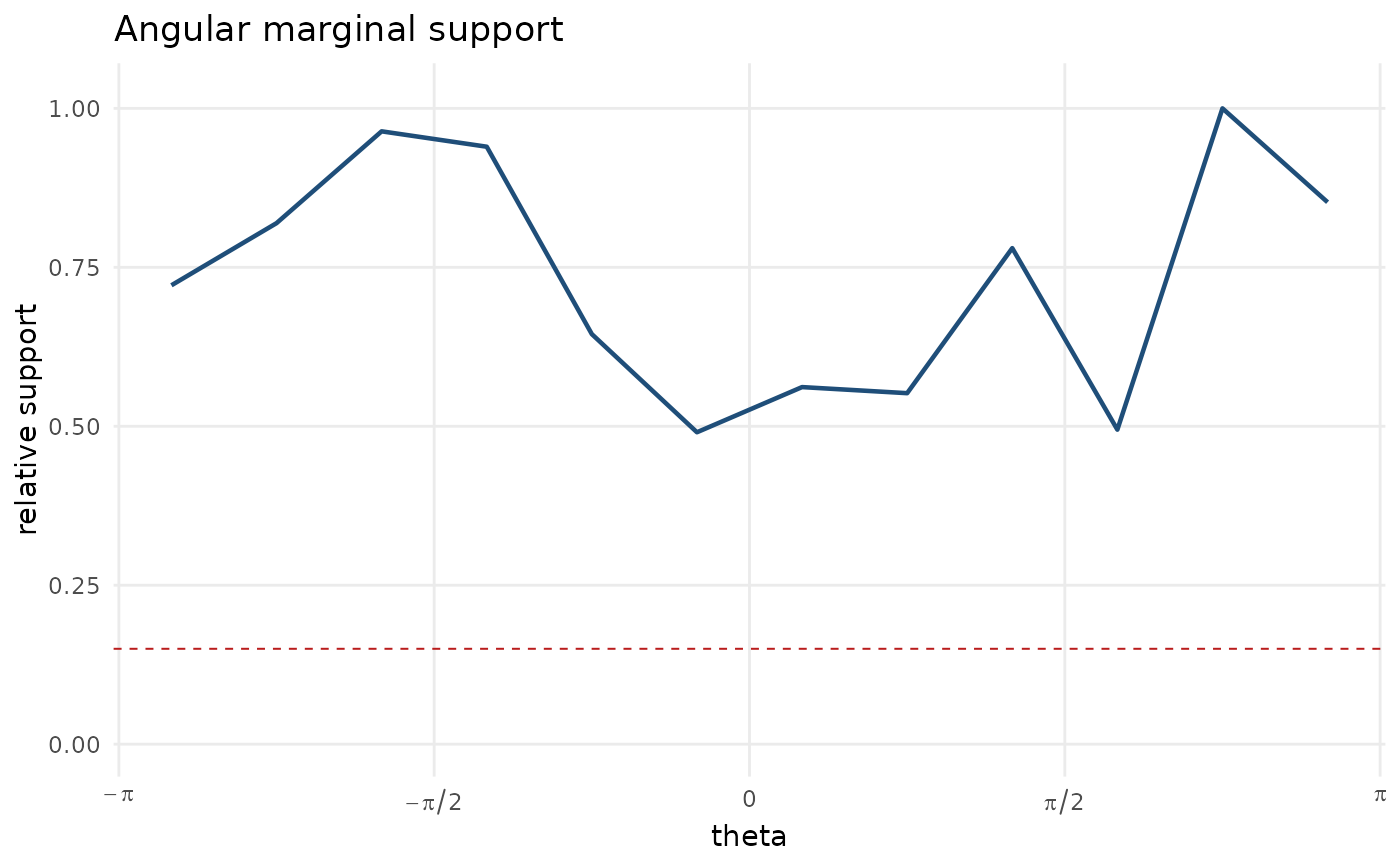
Plot angular marginal support
Usage
plot_marginal_support(
  theta,
  grid = NULL,
  n_theta = 181,
  kappa = 20,
  relative_threshold = 0.15,
  base_size = 11
)See also
Other directional uncertainty helpers:
autoplot.bootstrap_stat_orbit(),
autoplot.bootstrap_toroidal_ridge(),
bootstrap_stat_orbit(),
bootstrap_toroidal_ridge(),
marginal_support_data(),
sensitivity_bandwidth_grid(),
simulate_independence_lineup()
Examples
dat <- simulate_cylindrical(n = 60, seed = 1)
plot_marginal_support(dat$theta, n_theta = 12)