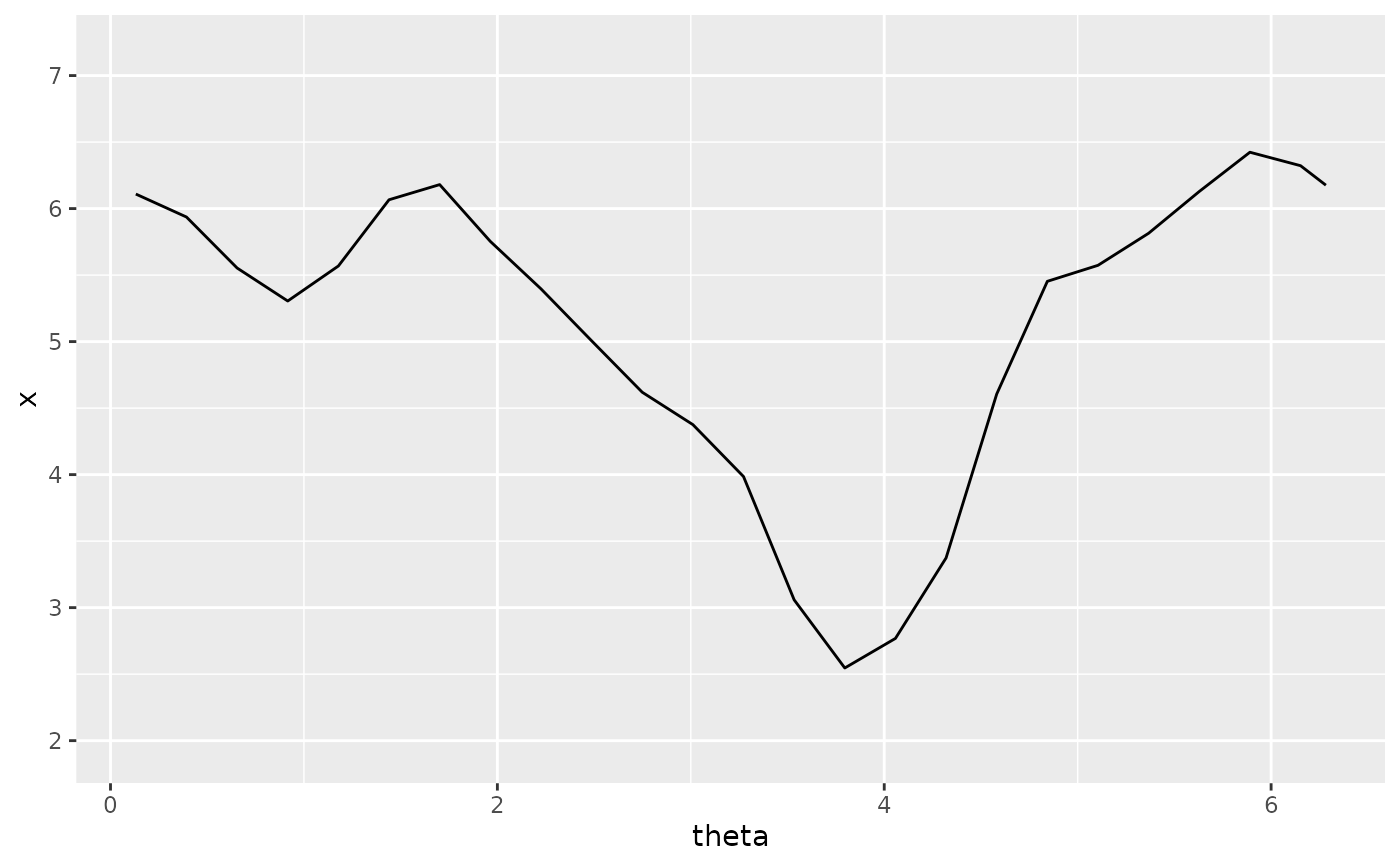
Add a statistical orbit line
Usage
stat_statistical_orbit(
  mapping = NULL,
  data = NULL,
  geom = "line",
  position = "identity",
  n_theta = 181,
  kappa = 20,
  ...,
  show.legend = NA,
  inherit.aes = TRUE
)See also
Other cylindrical dependence layers:
geom_phase_loom(),
stat_circular_topography(),
stat_statistical_orbit_ribbon()
Examples
dat <- simulate_cylindrical(n = 80, seed = 1)
ggplot2::ggplot(dat, ggplot2::aes(x = theta, y = x)) +
  stat_statistical_orbit(n_theta = 24)