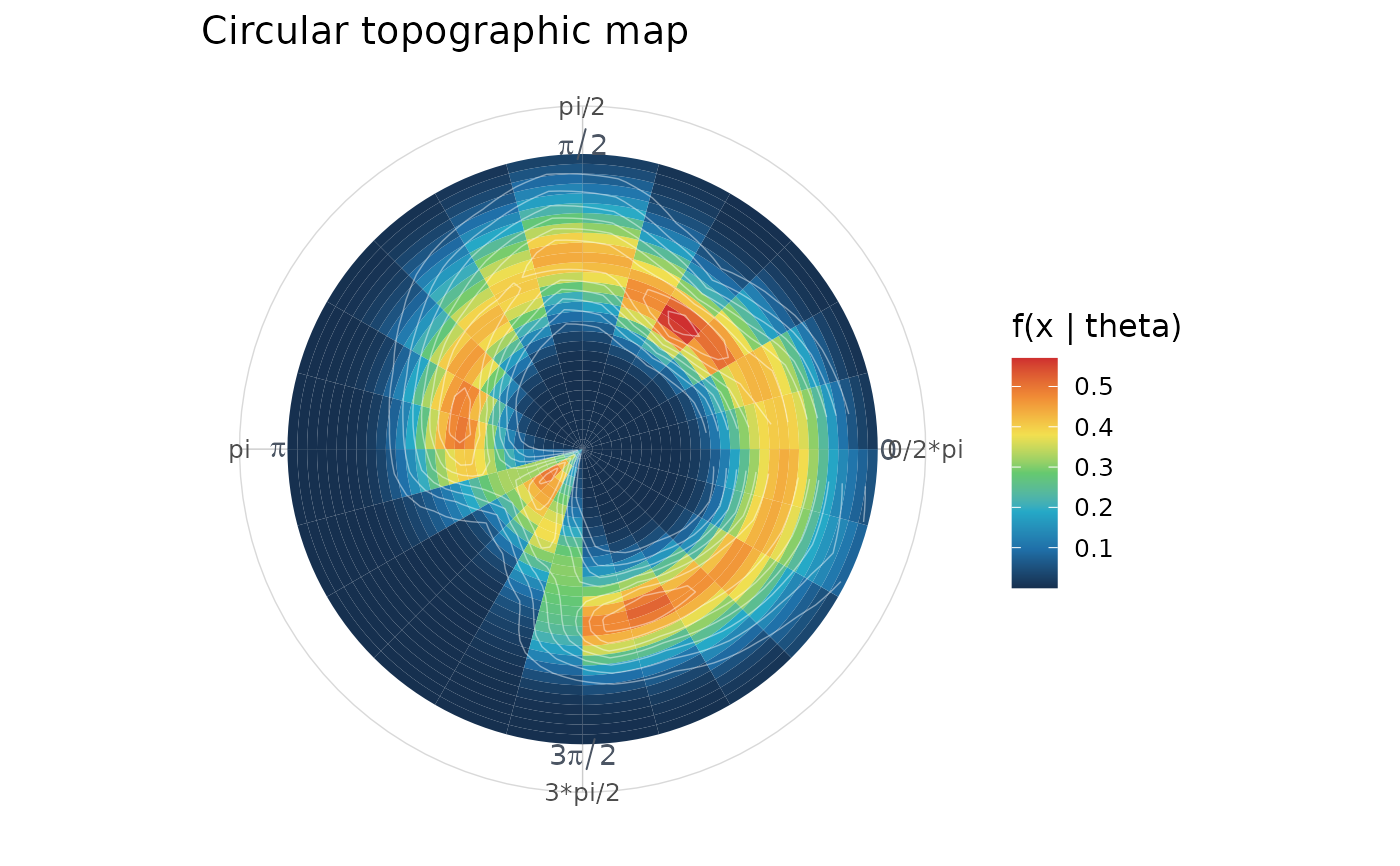
Plot circular topography
Usage
plot_circular_topography(
  theta,
  x,
  conditional = TRUE,
  ...,
  palette = topography_palette(),
  base_size = 12,
  legend_position = "right",
  show_legend = TRUE
)
Arguments
- theta
Angles in radians.
- x
Real-valued response.
- conditional
If
TRUE, rows are normalized to estimatef(x | theta).- ...
Additional arguments passed to
estimate_cyl_density().- palette
Colour palette for density.
- base_size
Base font size.
- legend_position
Legend position.
- show_legend
If
FALSE, hide legends.
See also
Other cylindrical dependence plots:
plot_circular_topography_3d(),
plot_phase_loom(),
plot_stat_orbit()
Examples
dat <- simulate_cylindrical(n = 80, seed = 1)
plot_circular_topography(dat$theta, dat$x, n_theta = 24, n_x = 30)