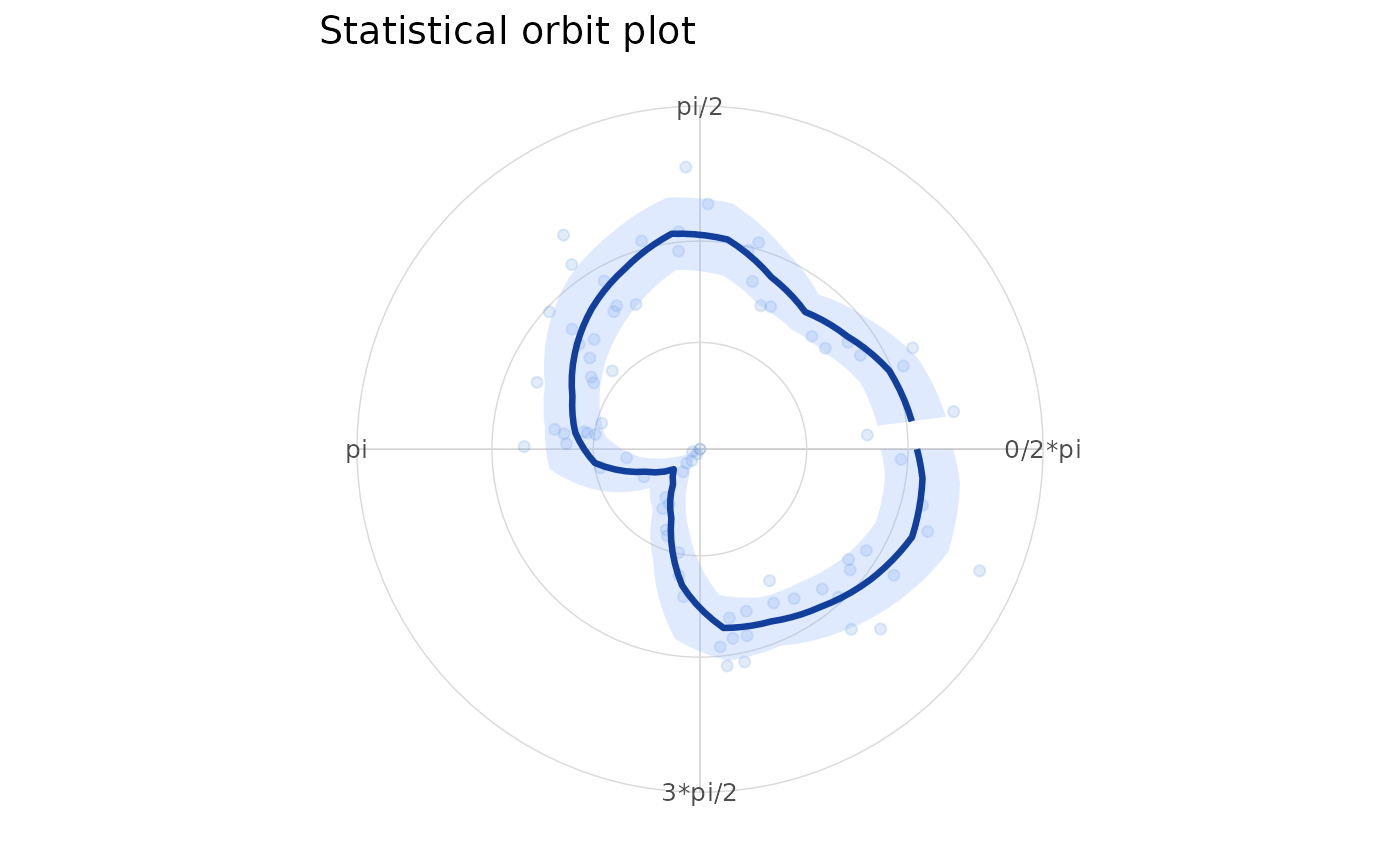
Plot a statistical orbit
See also
Other cylindrical dependence plots:
plot_circular_topography(),
plot_circular_topography_3d(),
plot_phase_loom()
Examples
dat <- simulate_cylindrical(n = 80, seed = 1)
plot_stat_orbit(dat$theta, dat$x, n_theta = 24)