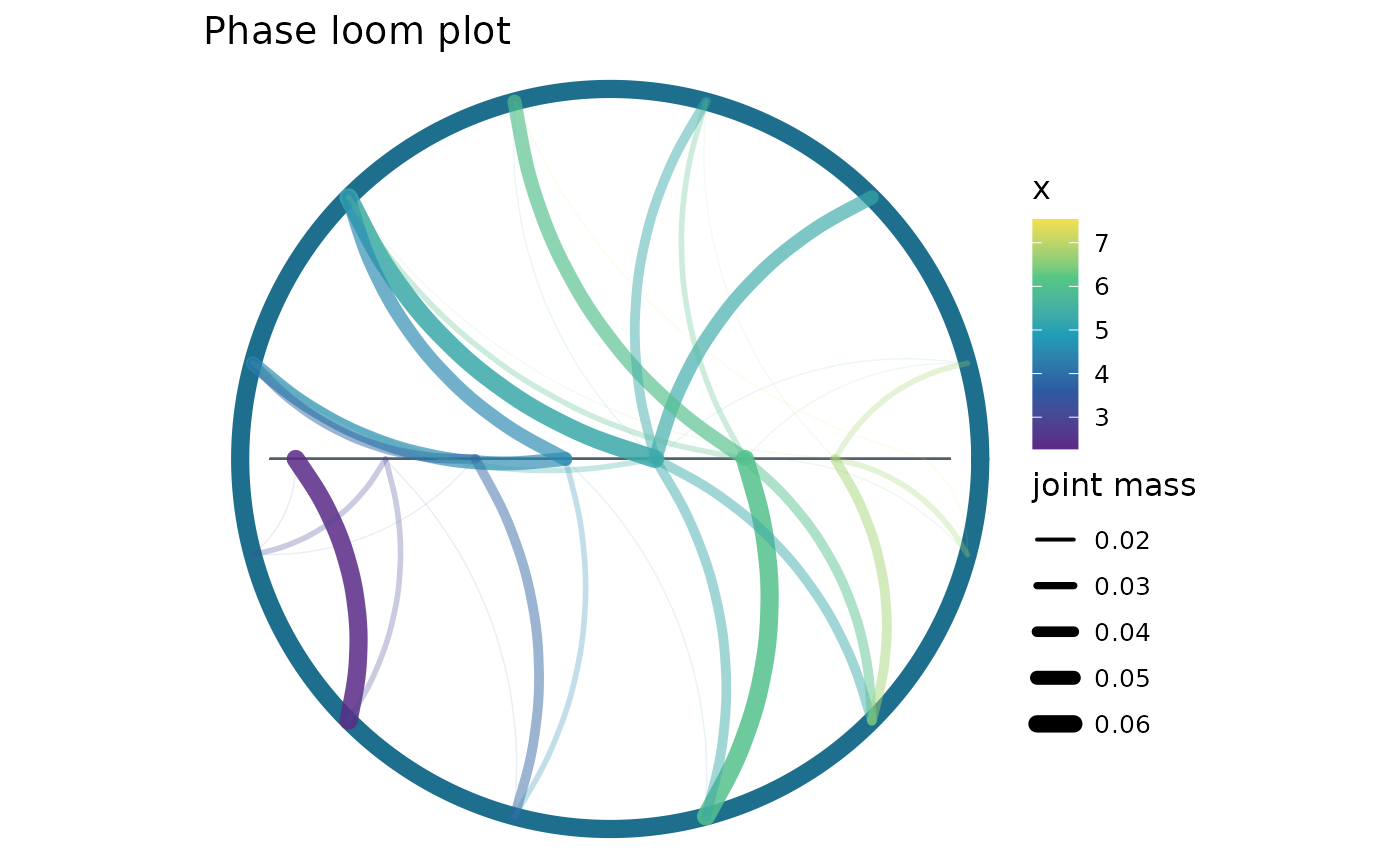
Plot a phase loom
Usage
plot_phase_loom(
  theta,
  x,
  n_sectors = 48,
  n_x_bins = 24,
  min_mass = 0.002,
  max_flows = 180,
  mass_type = c("joint", "conditional"),
  palette = flow_palette(),
  base_size = 12,
  legend_position = "right",
  show_legend = TRUE
)
Arguments
- theta
Angles in radians.
- x
Real-valued response.
- n_sectors
Number of angular sectors.
- n_x_bins
Number of linear bins.
- min_mass
Minimum mass to retain.
- max_flows
Maximum number of flows to retain. Use
NULLto keep all.- mass_type
Either
"joint"for joint masses or"conditional"for masses normalized within each angular sector.- palette
Colour palette for response levels.
- base_size
Base font size.
- legend_position
Legend position.
- show_legend
If
FALSE, hide legends.
See also
Other cylindrical dependence plots:
plot_circular_topography(),
plot_circular_topography_3d(),
plot_stat_orbit()
Examples
dat <- simulate_cylindrical(n = 80, seed = 1)
plot_phase_loom(dat$theta, dat$x, n_sectors = 12, n_x_bins = 8)
#> Warning: All aesthetics have length 1, but the data has 80 rows.
#> ℹ Please consider using `annotate()` or provide this layer with data containing
#>   a single row.