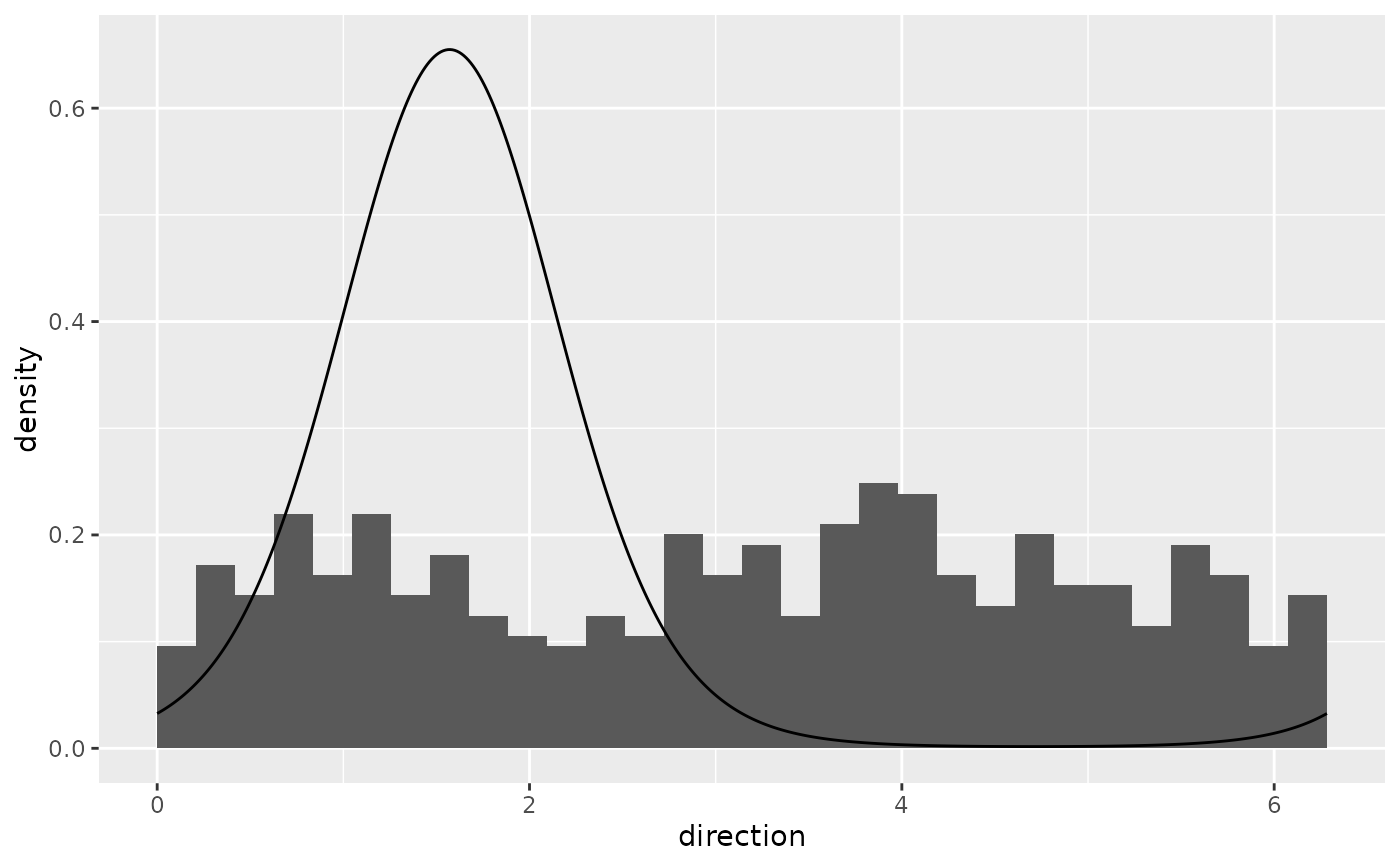
Adds a theoretical von Mises density to a circular plot.
Usage
stat_vonmises(
  mapping = NULL,
  data = NULL,
  geom = "line",
  position = "identity",
  ...,
  mu = 0,
  kappa = 1,
  n = 512,
  axial = FALSE,
  na.rm = FALSE,
  show.legend = NA,
  inherit.aes = FALSE
)

stat_wrapped_normal(
  mapping = NULL,
  data = NULL,
  geom = "line",
  position = "identity",
  ...,
  mu = 0,
  sigma = 1,
  terms = 5,
  n = 512,
  axial = FALSE,
  na.rm = FALSE,
  show.legend = NA,
  inherit.aes = FALSE
)

stat_uniform_circular(
  mapping = NULL,
  data = NULL,
  geom = "line",
  position = "identity",
  ...,
  n = 512,
  axial = FALSE,
  na.rm = FALSE,
  show.legend = NA,
  inherit.aes = FALSE
)
Arguments
- mapping, data, geom, position, show.legend, inherit.aes
Standard ggplot2 layer arguments.
- ...
Additional arguments passed to the layer.
- mu
Mean direction in radians.
- kappa
Non-negative concentration parameter.
- n
Number of grid points.
- axial
Should the density be drawn over an axial period of
pi?- na.rm
Included for ggplot2 layer compatibility.
- sigma
Standard deviation of the wrapped normal distribution.
- terms
Number of wrapping terms on each side of the origin.
See also
Other circular distributions:
fit_vonmises_mixture(),
stat_vonmises_fit(),
stat_vonmises_mixture()
Examples
ggplot2::ggplot(wind_directions, ggplot2::aes(x = direction)) +
  geom_rose(ggplot2::aes(y = ggplot2::after_stat(density))) +
  stat_vonmises(mu = pi / 2, kappa = 3)