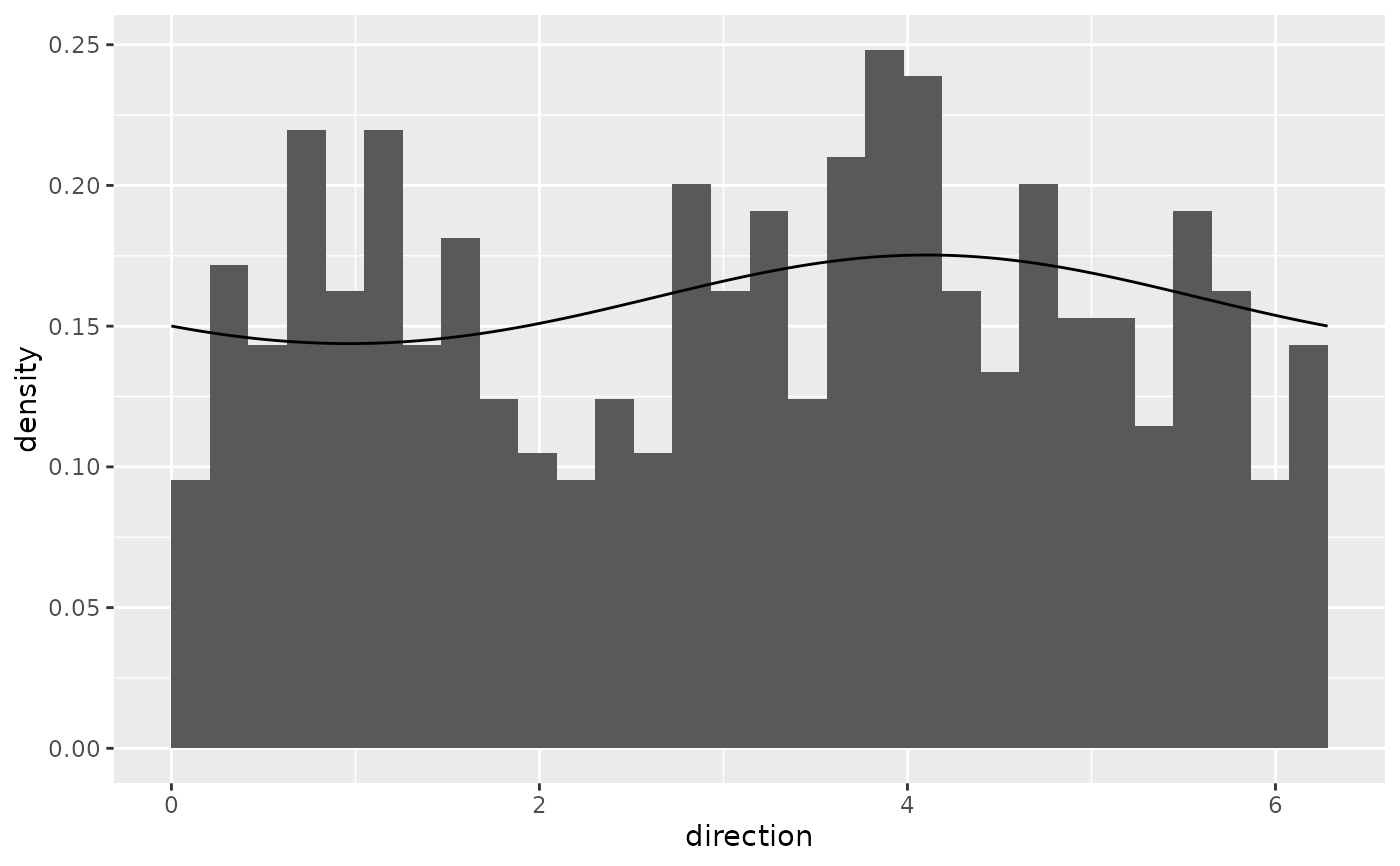
Estimates mu with mean_direction() and kappa with estimate_kappa(),
then draws the fitted von Mises density.
Usage
stat_vonmises_fit(
  mapping = NULL,
  data = NULL,
  geom = "line",
  position = "identity",
  ...,
  n = 512,
  axial = FALSE,
  na.rm = FALSE,
  show.legend = NA,
  inherit.aes = TRUE
)See also
Other circular distributions:
fit_vonmises_mixture(),
stat_vonmises(),
stat_vonmises_mixture()
Examples
ggplot2::ggplot(wind_directions, ggplot2::aes(x = direction)) +
  geom_rose(ggplot2::aes(y = ggplot2::after_stat(density))) +
  stat_vonmises_fit()