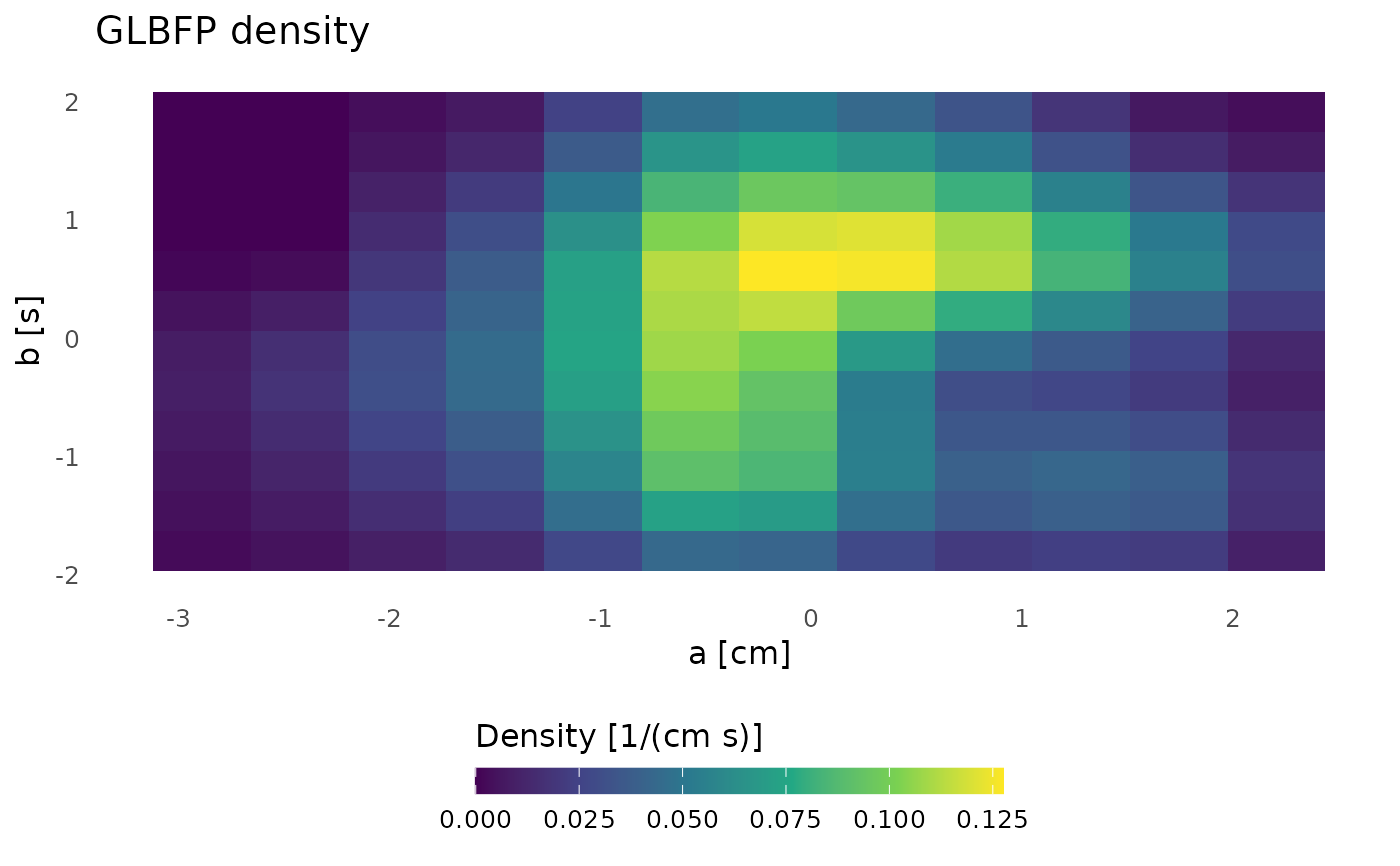
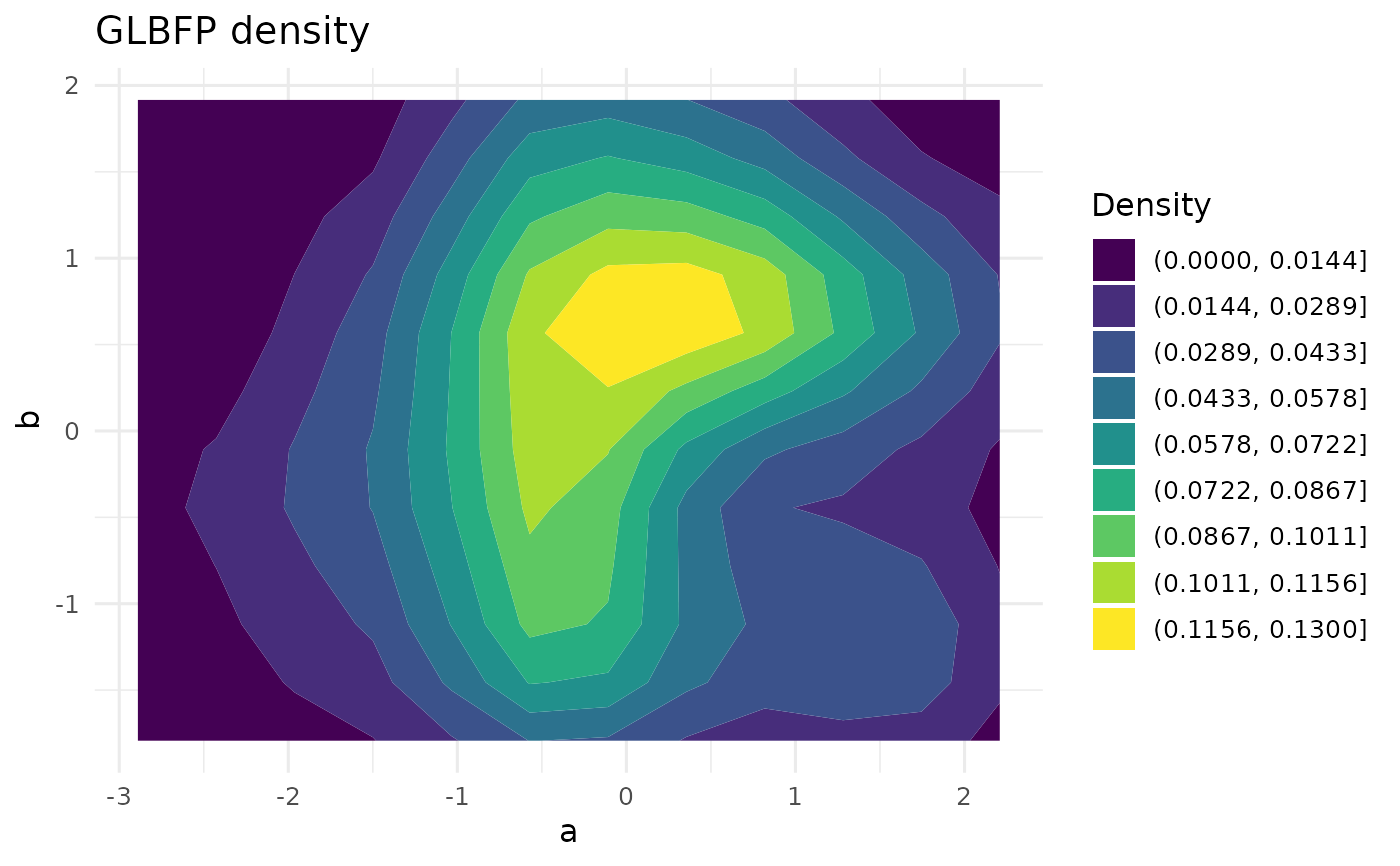
Visualize estimated densities in one to three observation dimensions
Source:R/plot_density.R
plot_density.RdA surface for d=2 uses height for density. For d=3, all three spatial
plot axes represent observation components; density is shown by slices or
isosurfaces. Neither plot dimension refers to the index dimension N.
Usage
plot_density(
  x,
  type = NULL,
  labels = NULL,
  units = x$units,
  slice_dim = 3L,
  slices = NULL,
  isomin = NULL,
  isomax = NULL,
  surface_count = 3L,
  title = NULL
)
Arguments
- x
A grid fit from
GLBFP_estimate()or its ASH/LBFP counterparts.- type
"line","heatmap","contour","surface","slices", or"isosurface". Default depends on the observation dimension.- labels
Optional vector of observation axis labels (length
d).- units
Optional vector of units (length
d); defaults to field units. Density units are the reciprocal of their product, not the original units.- slice_dim
Observation dimension held fixed for slices (default 3).
- slices
Values on that grid axis. Default uses up to three evenly spaced interior grid planes. A slice is a joint-density section, not a marginal or conditional density and is not renormalized.
- isomin, isomax
Optional lower and upper isosurface density levels.
- surface_count
Number of equally spaced isosurfaces (default 3).
- title
Optional title.